We were tasked to create an app that optimizes the car buying experience for the country’s leading experts on cars and reviews.
Consumer Reports
UX Design, 2015

Role
- Lead Designer
Year
2014
Skills
- User Research
- Information Architecture
- UX Design
About
Consumer Reports in a household name. They are known for their unbiased, trusted, and expert reviews of appliances, electronics, and most popularly, cars. They are a leader in their industry, but had found themselves slowly losing traction with the rise of Amazon, CNET, and other free review sites. So in 2014, a small group of us were selected to run a bit of an experiment. Get an incubator space in NYC and work as a small independent agile team to release an app in 60 days. We were tasked to find a solution that intersected the company’s offerings, unbiased and trusted reviews, with our audiences’ pain points. An app was chosen in order to get the company a foothold in the app space and increase public awareness of the brand. Here: was our journey.
01 Discovery
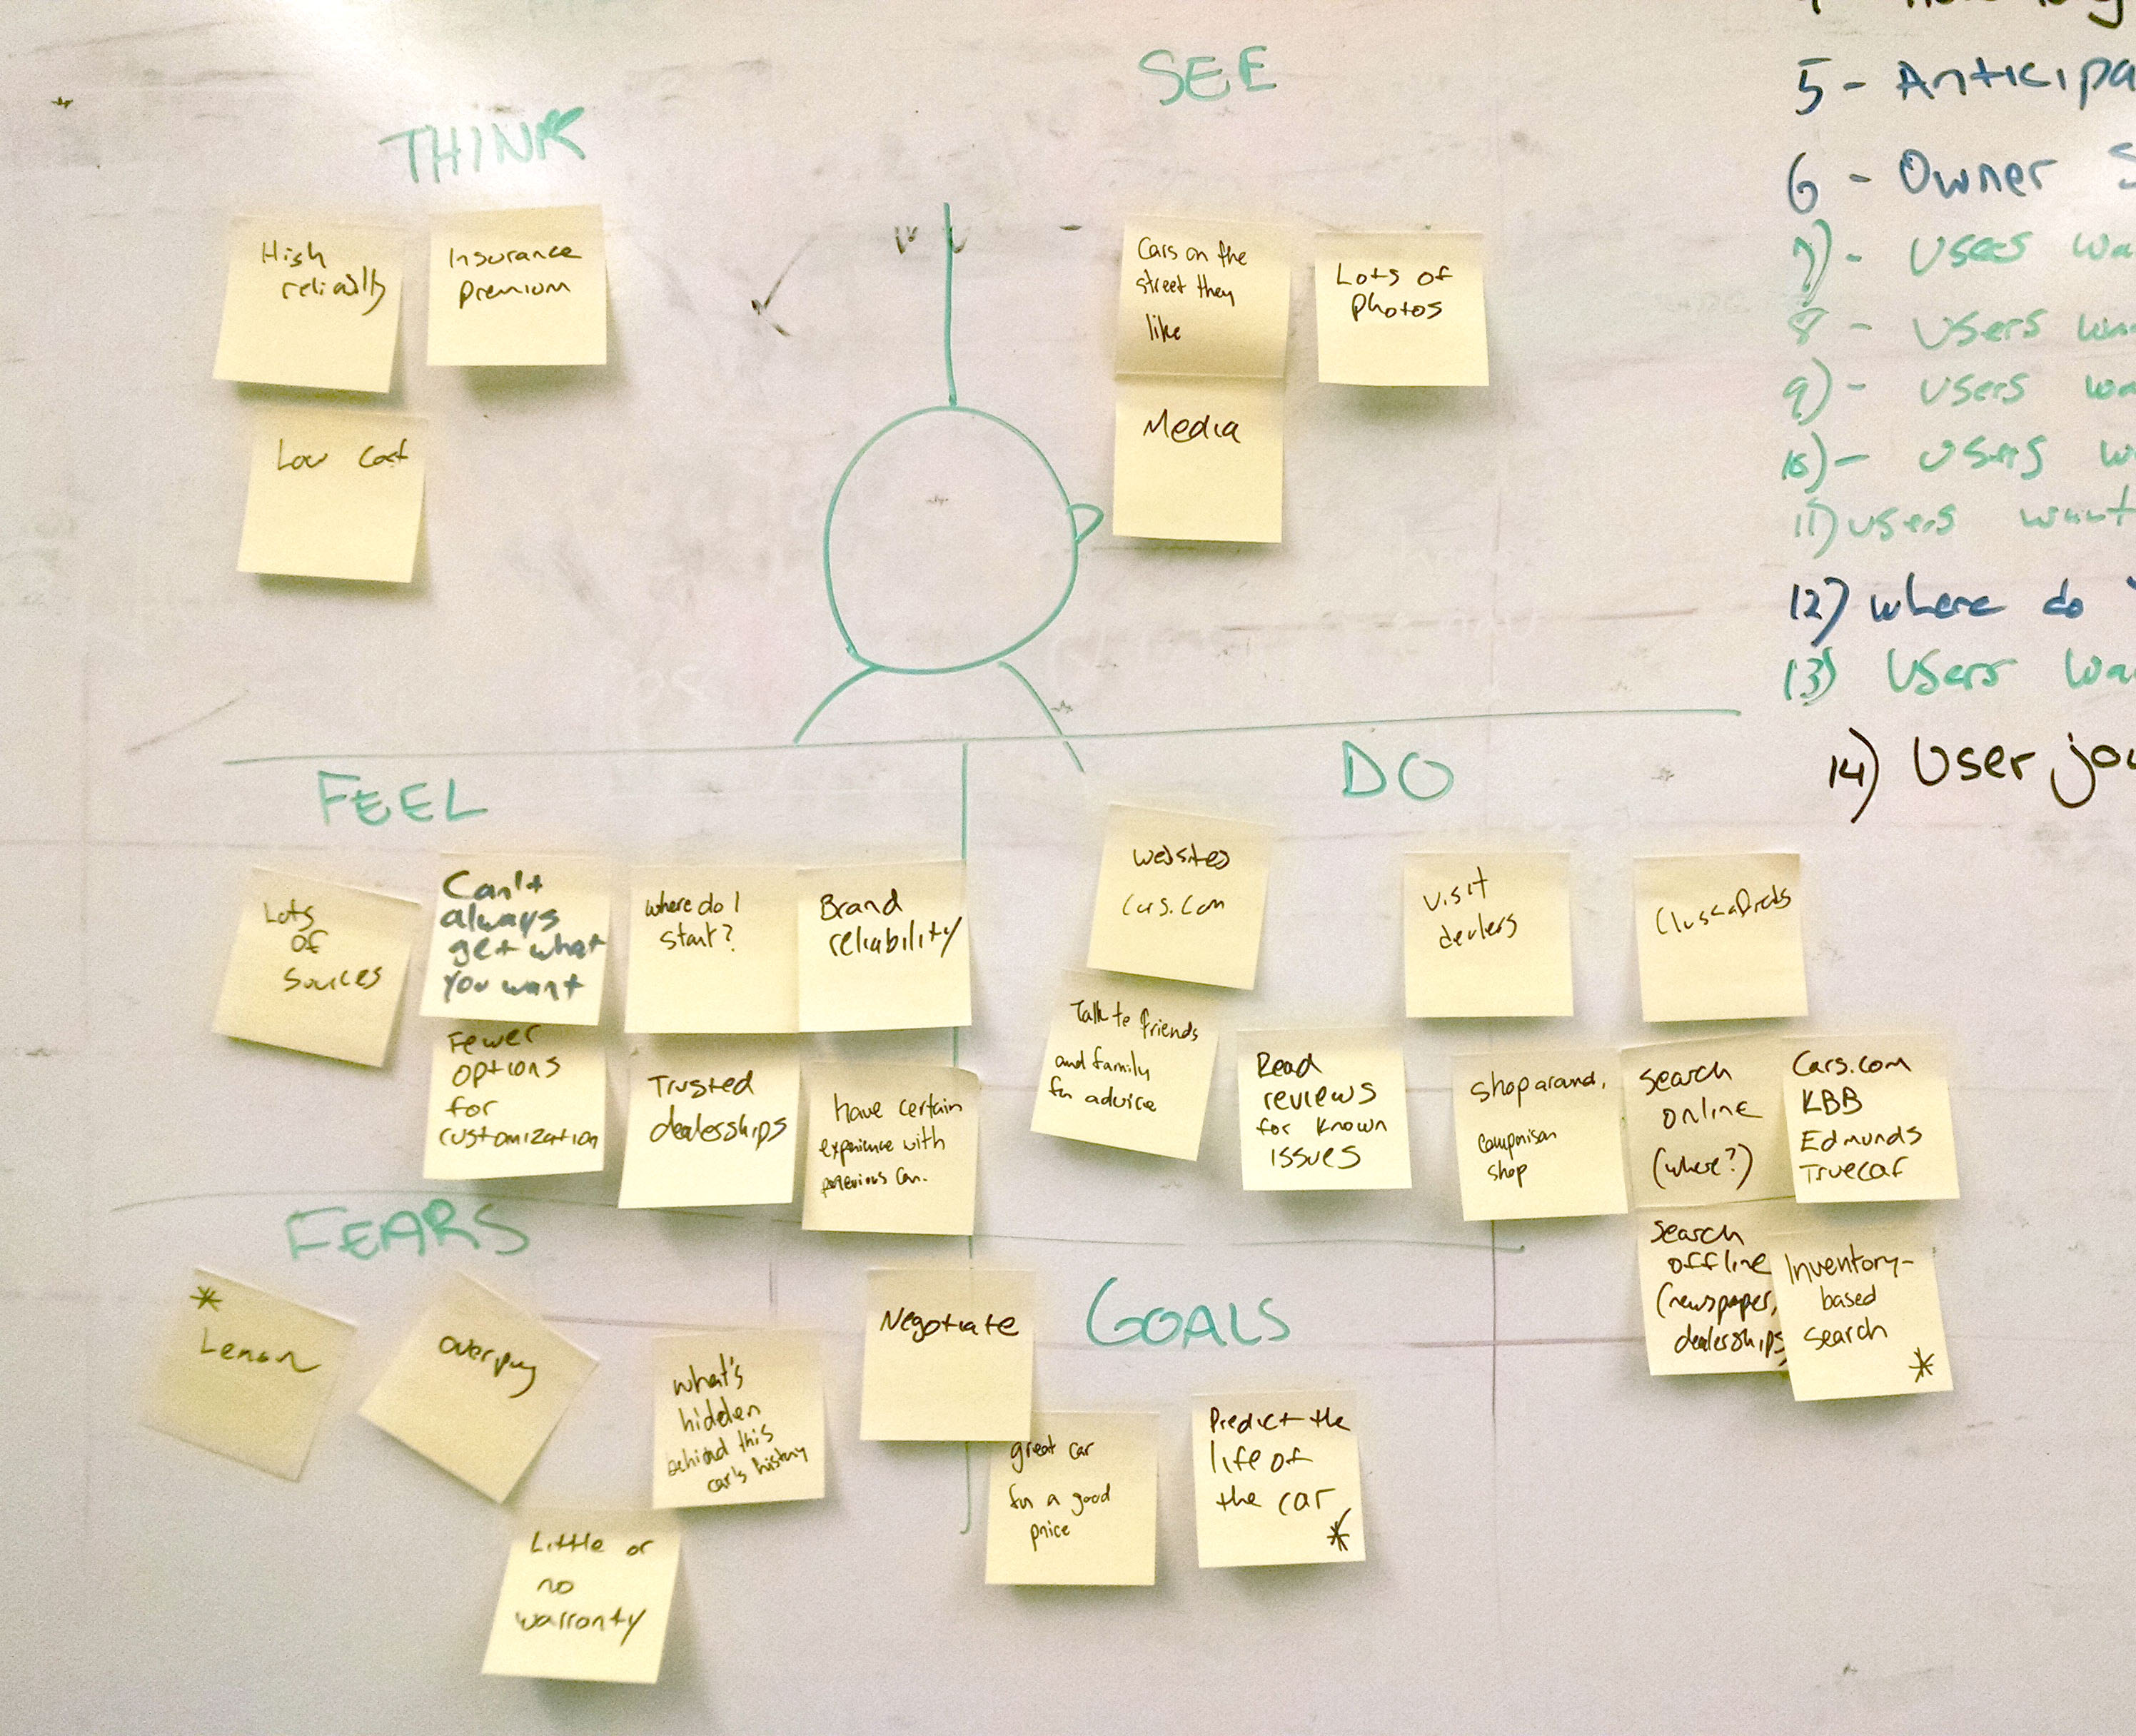
User Research
In order to find our audiences’ pain points, we embarked on a two week lean UX discovery. We roamed around malls, stalked car dealerships and interviewed dozens of people on their most recent car purchase. We learned how they went about researching a car, how they chose a dealership, how they felt about their purchases and where they had wished it could have been better. We mapped our findings through empathy maps, journeys, and user flows to find patterns in behavior.
02 Discovery
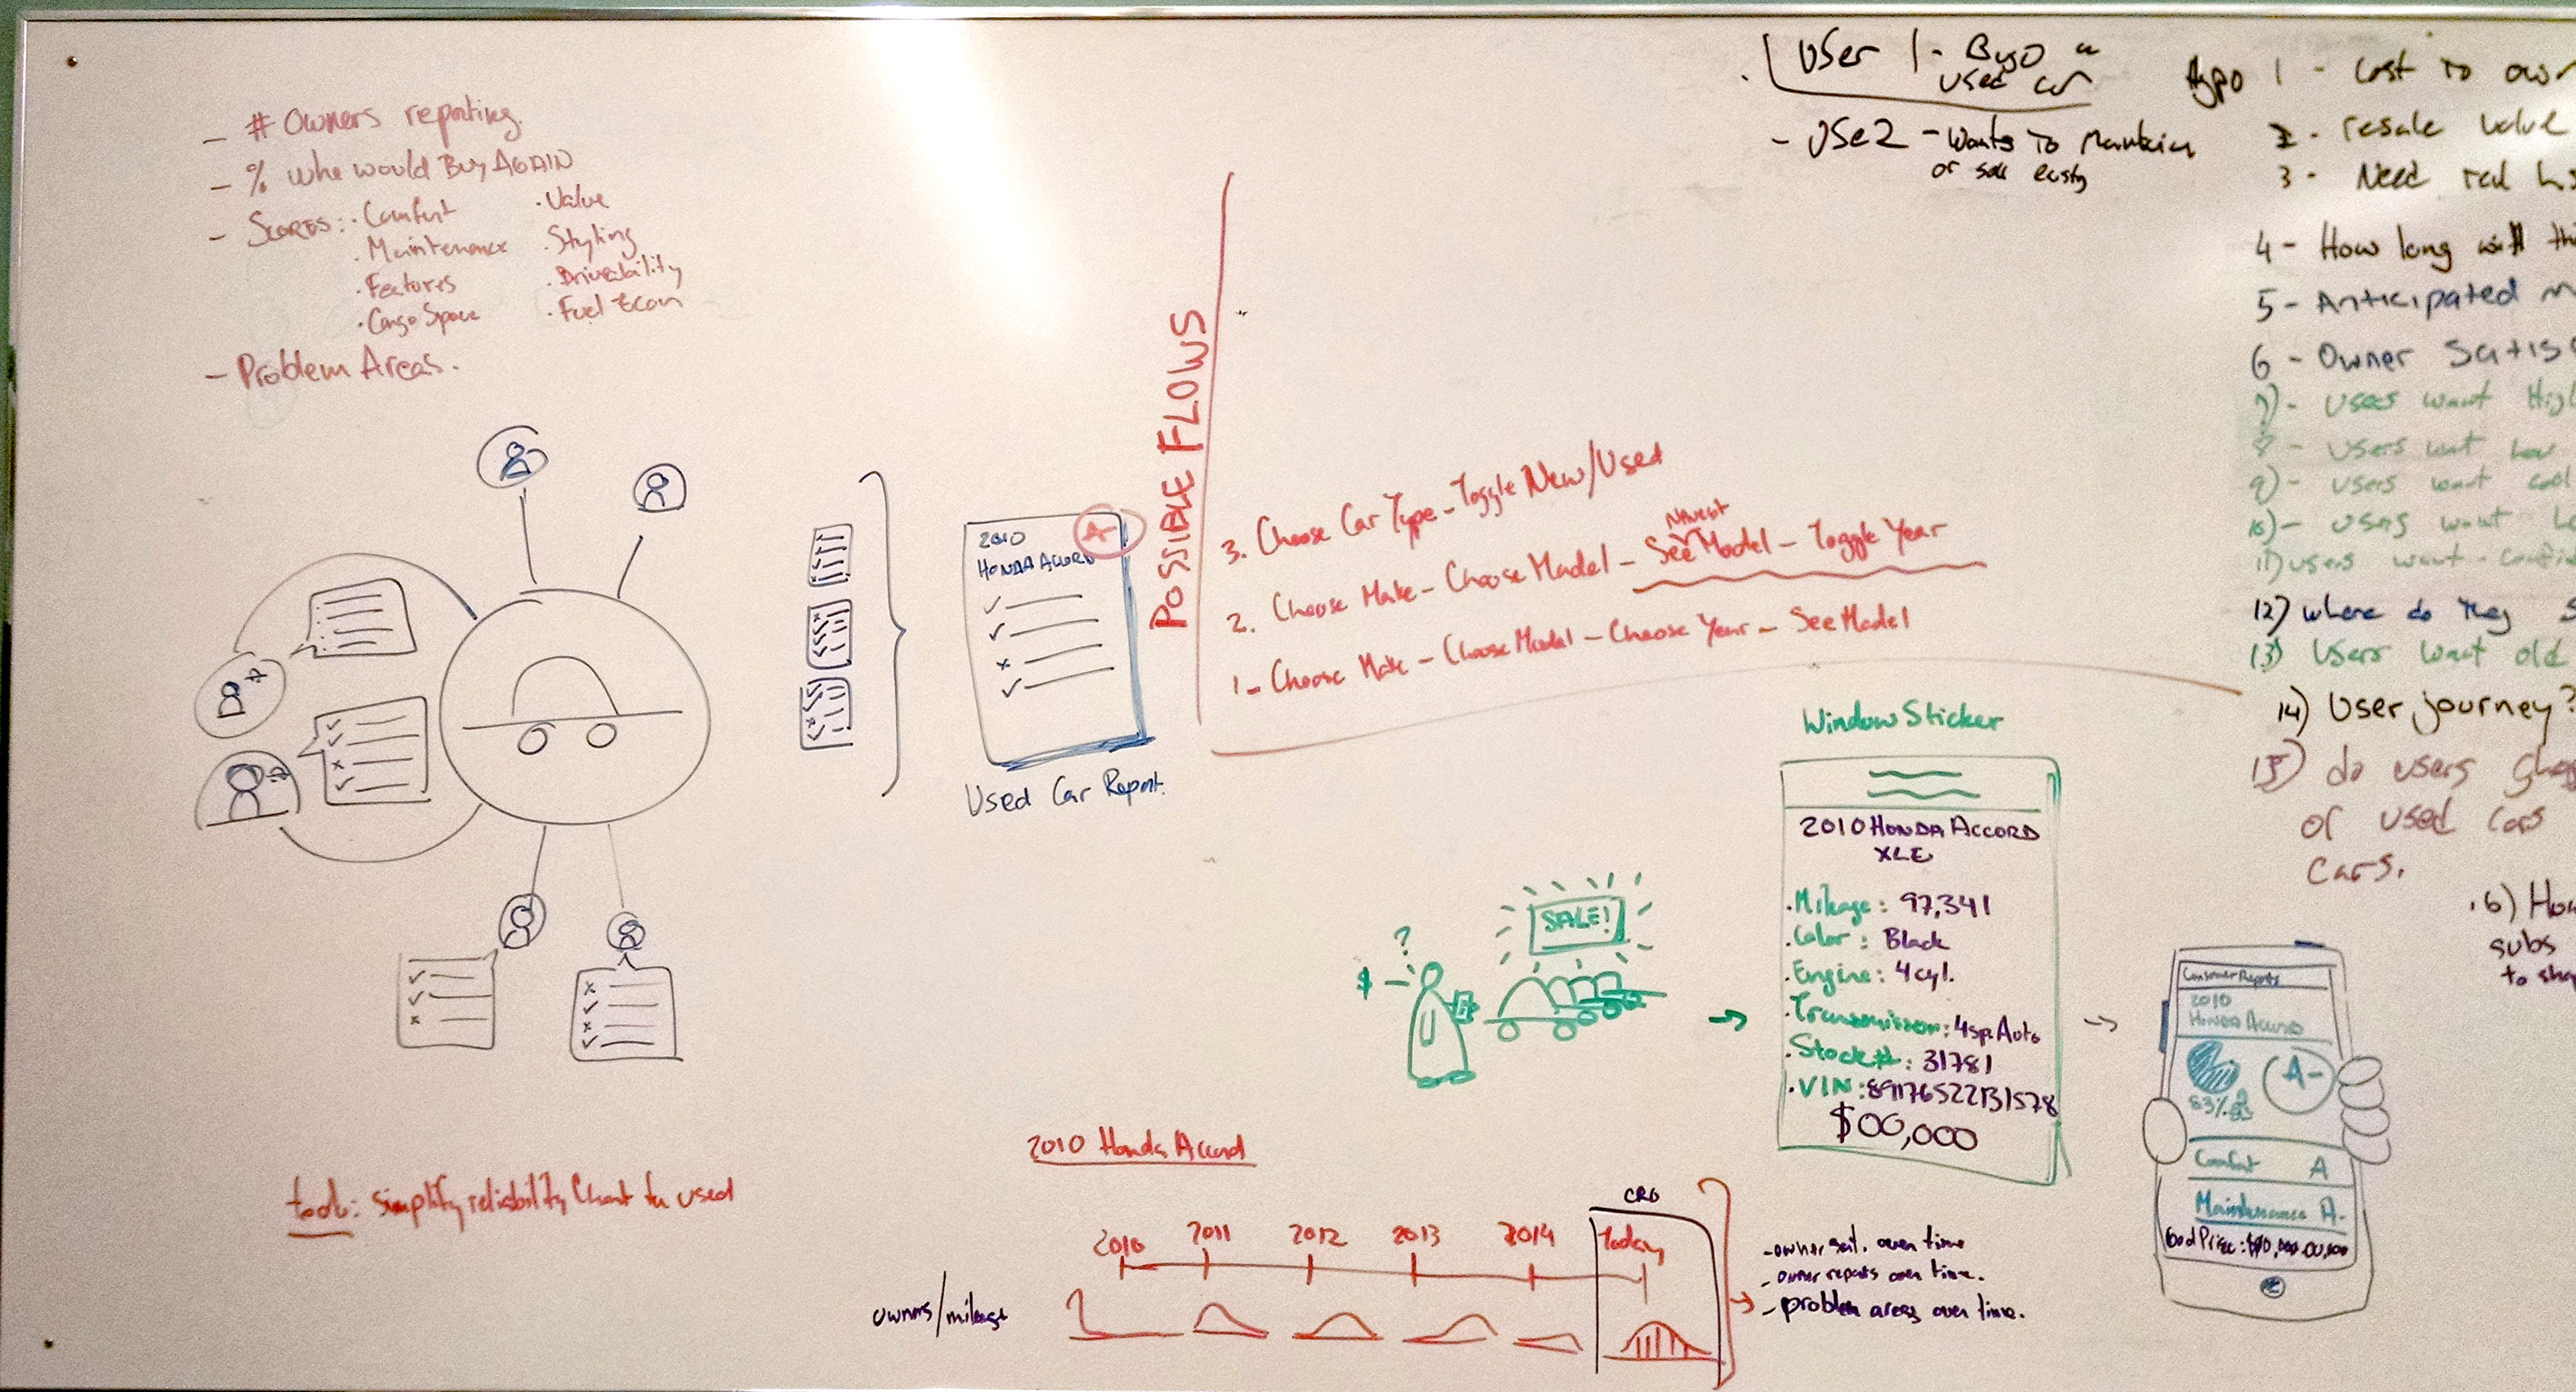
The User Journey
With our research notes in hand, we developed a complete user journey from initial decision to final purchase. There were two obvious pain points that we knew could solve for. The initial research phase, where a user is still trying to decide on the type of car they want and the dealership negotiation. Without fail almost all the people we talked to mentioned negotiating and haggling as a major pain point. Their lack of confidence seemed to stem from the fact that prices were extremely difficult to calculate. They either walked away having no idea if they got a good deal since they didn’t know the invoice price of the car (the price the dealer paid), or they negotiated a good deal only be tacked on by last minute fees and taxes at the final signing.
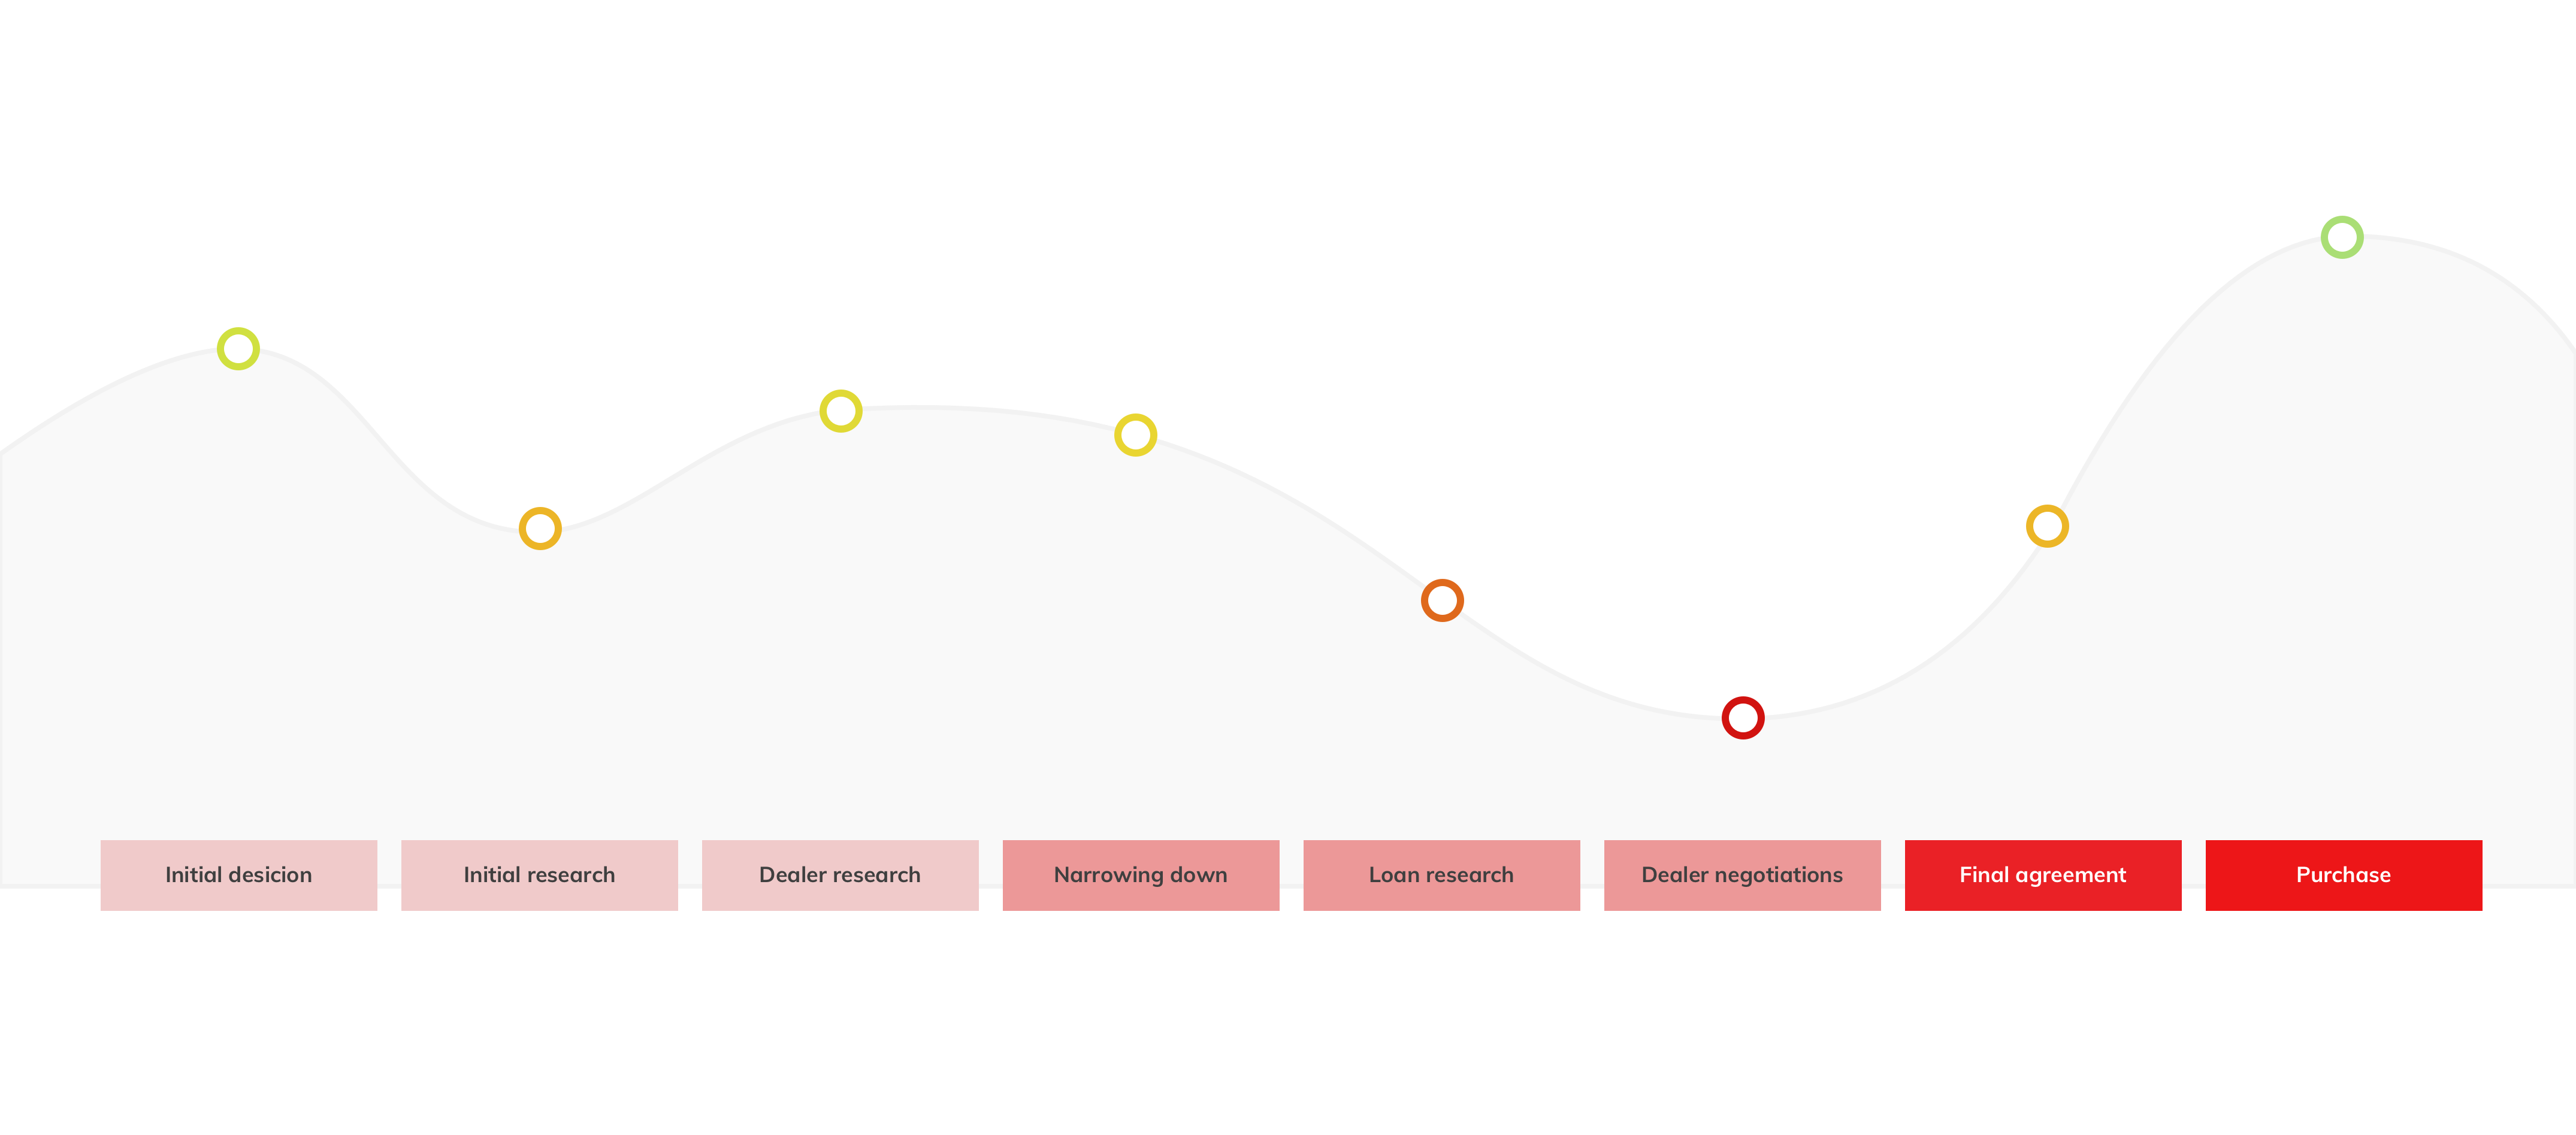
1
The initial research phase. When users are trying to sort out which are top cars they are going for
2
The negotiation phase. When users have their top 3 choices but are trying to figure out what the best deal is.
03 Discovery
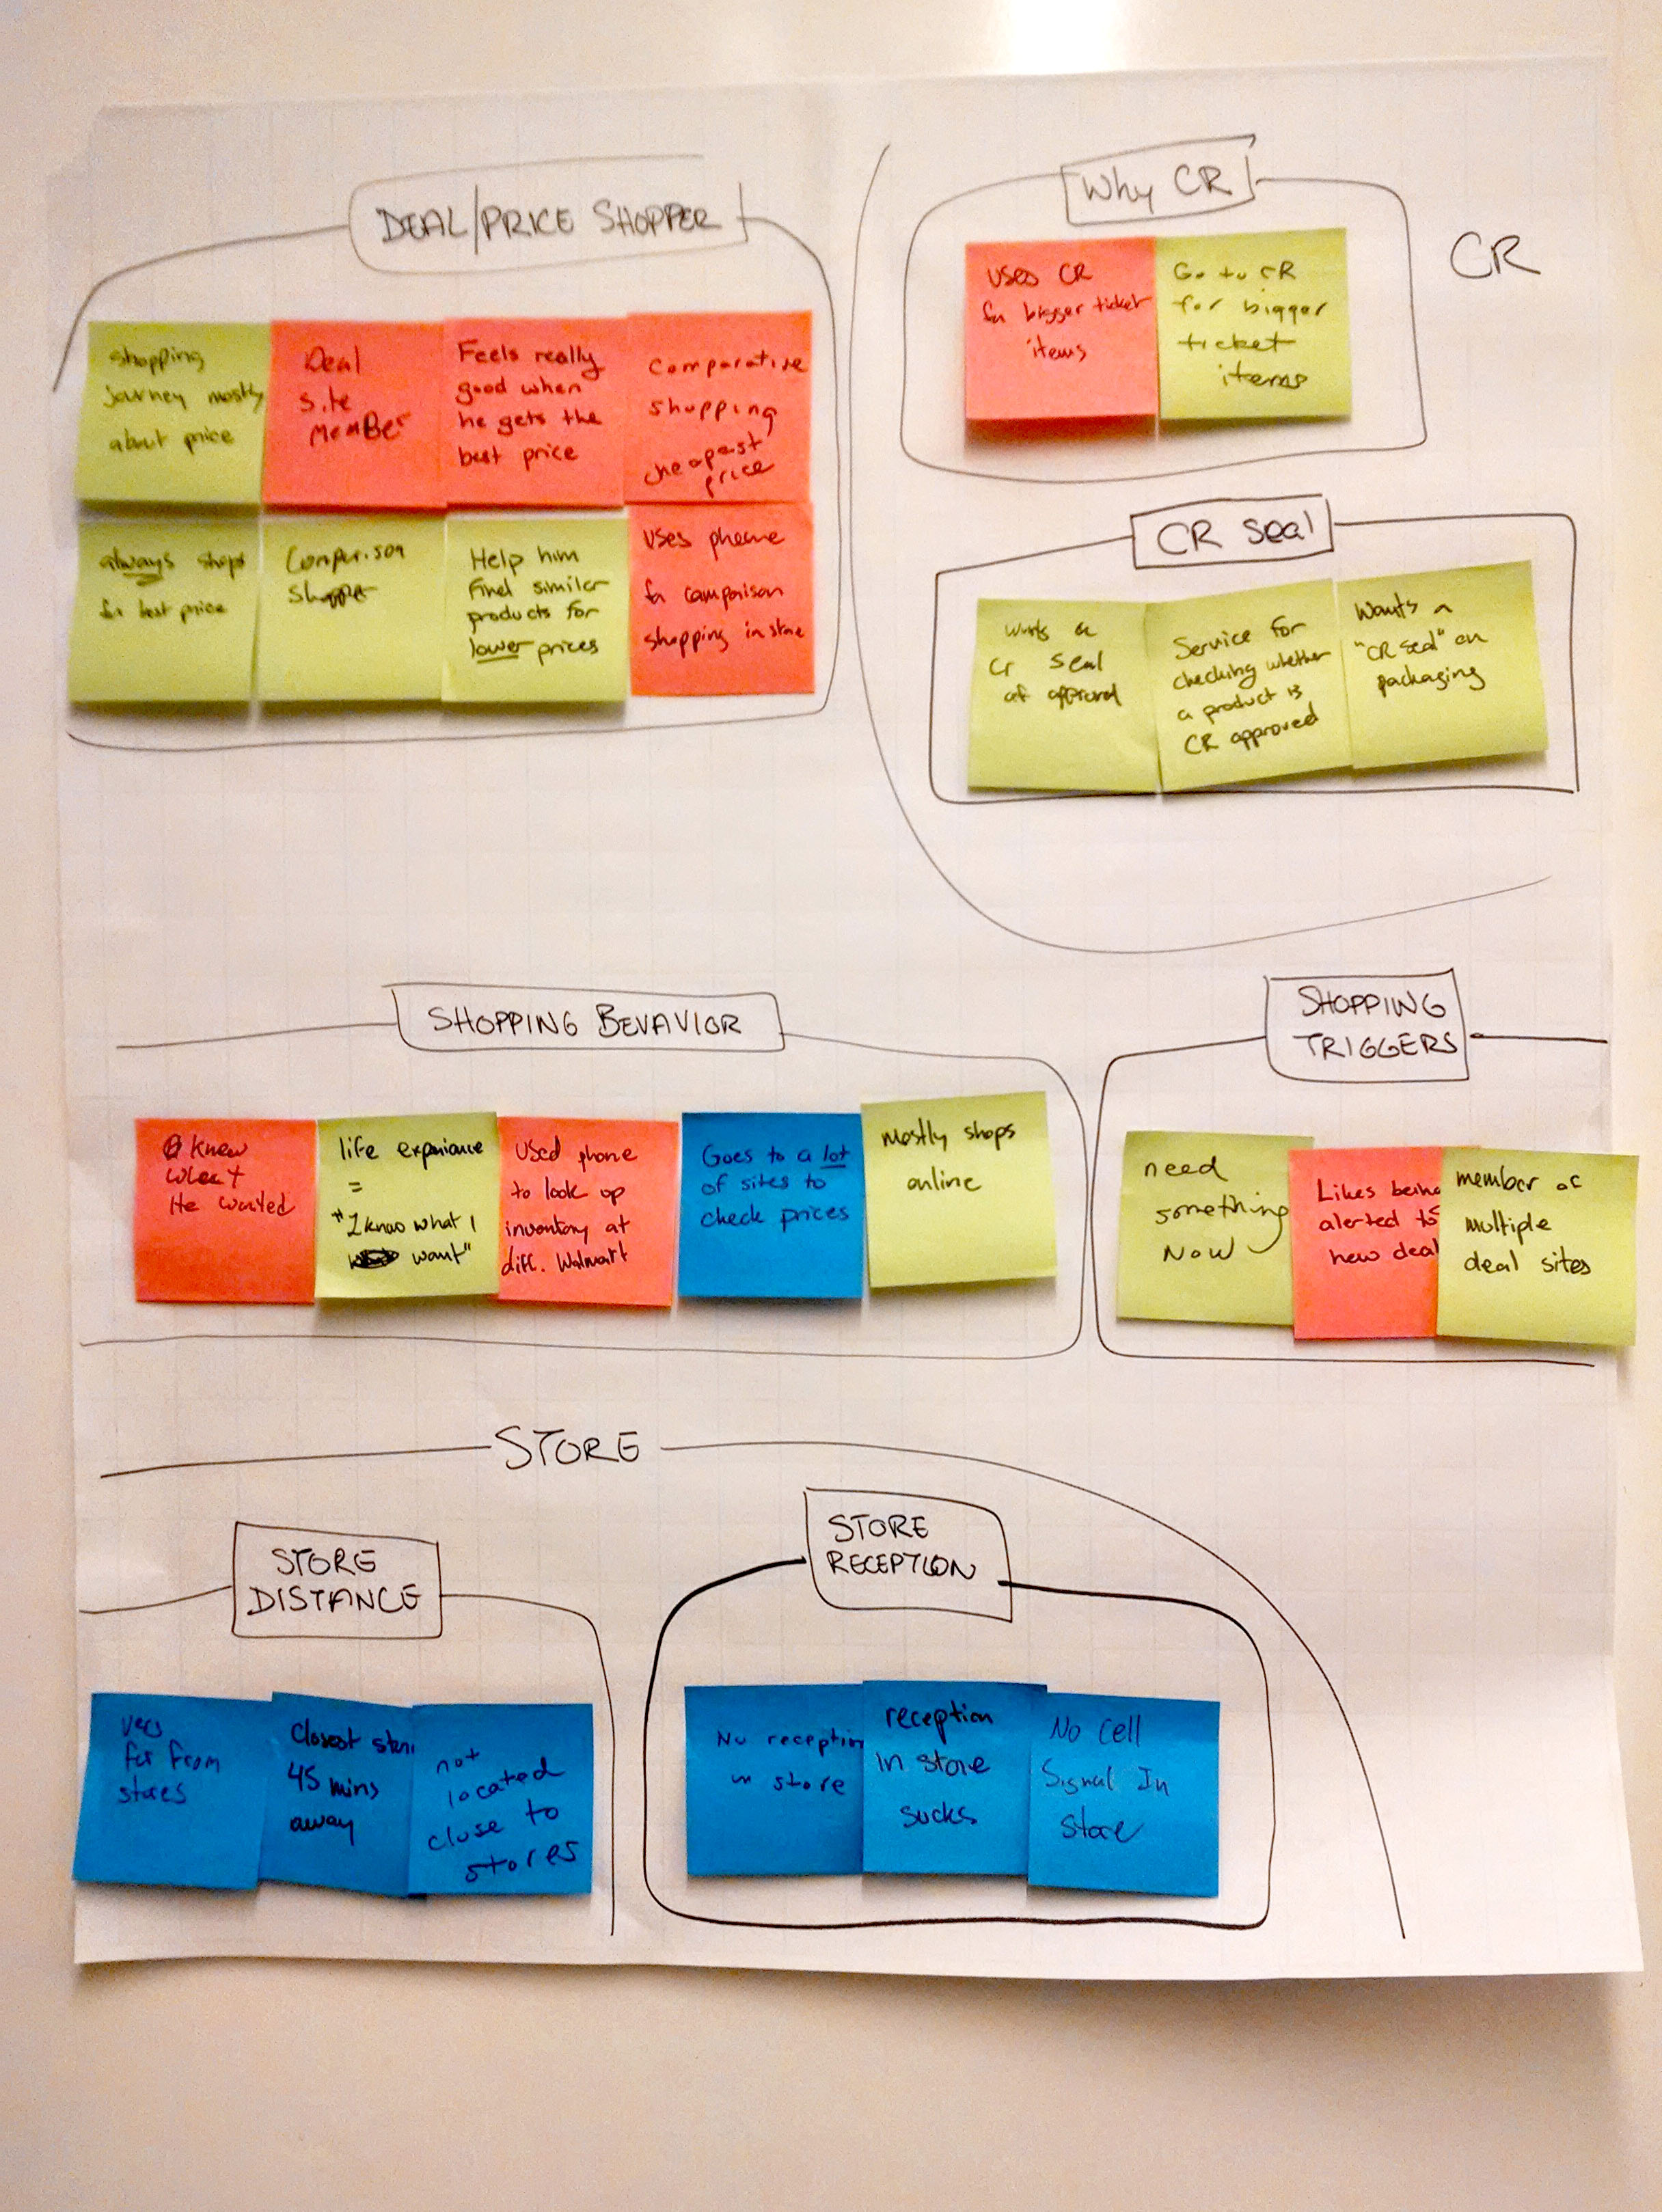
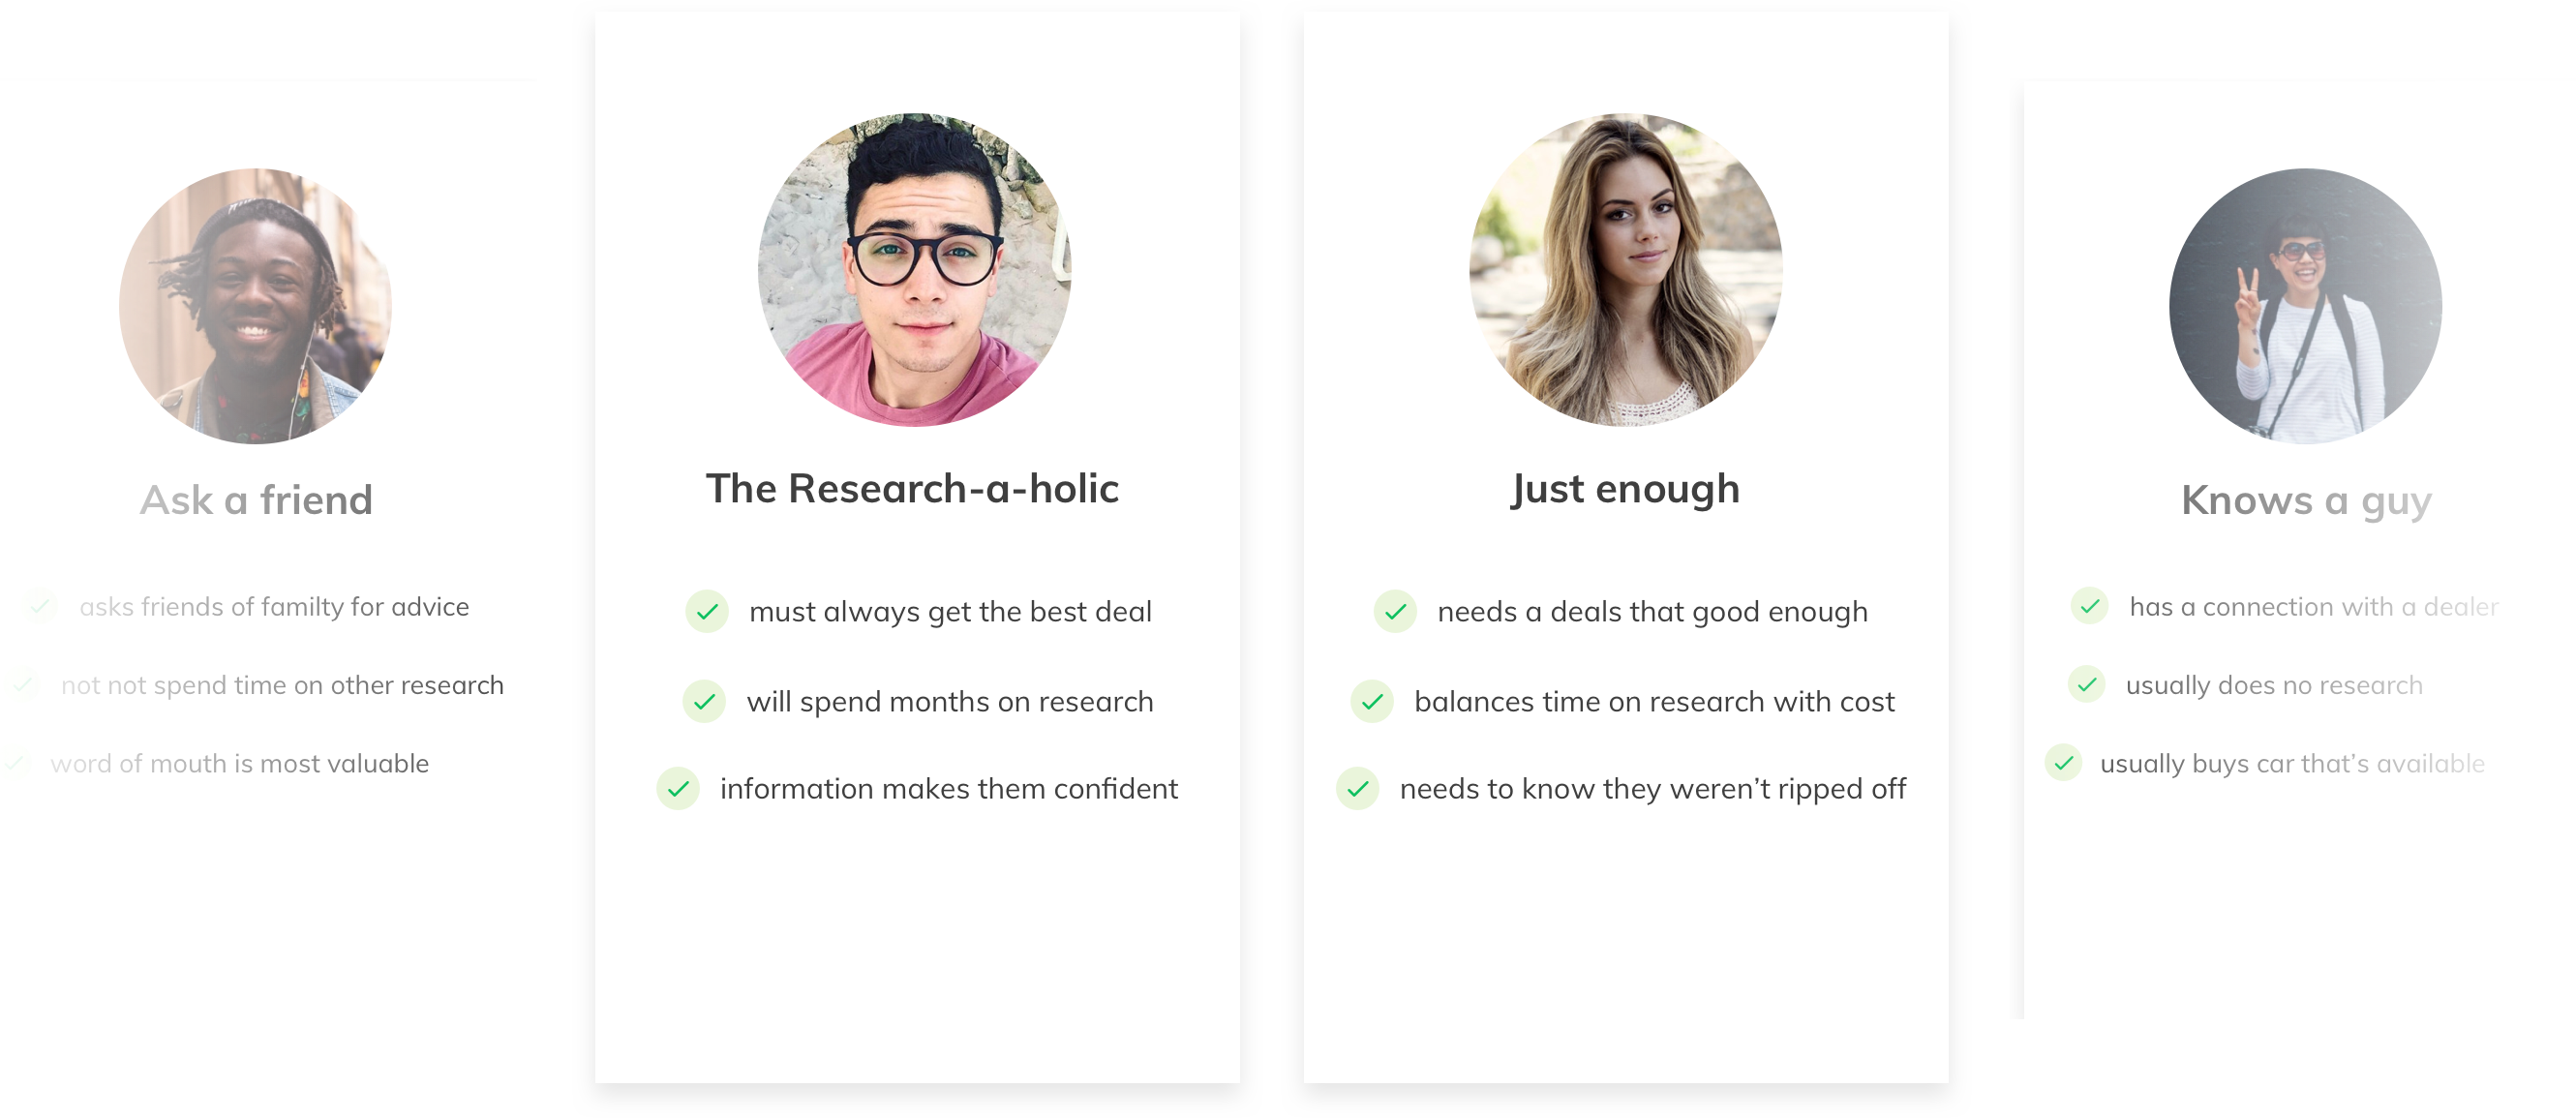
Personas
We also discovered four types of users. There were two, the “Knows a guy” and the “Ask a friend” who weren’t quite our target audience. These two personas did very little research. They either had a contact or family member who was a car salesman and therefore got the best price, or simply valued word of mouth above all else, and bought what their friends or family recommended. In contrast, the “Research-a-holic” was our golden egg. These users loved research and would block out months for it and often bragged about the deals they got. Holding ALL the knowledge helped them feel empowered, especially when confronted with a salesman. Our secondary user was the “Just Enough” persona. They would research as much as they felt was necessary as they valued their time doing other things. They didn’t need the absolute best deal. They just needed to feel like they weren’t getting ripped off.
04 Information Architecture
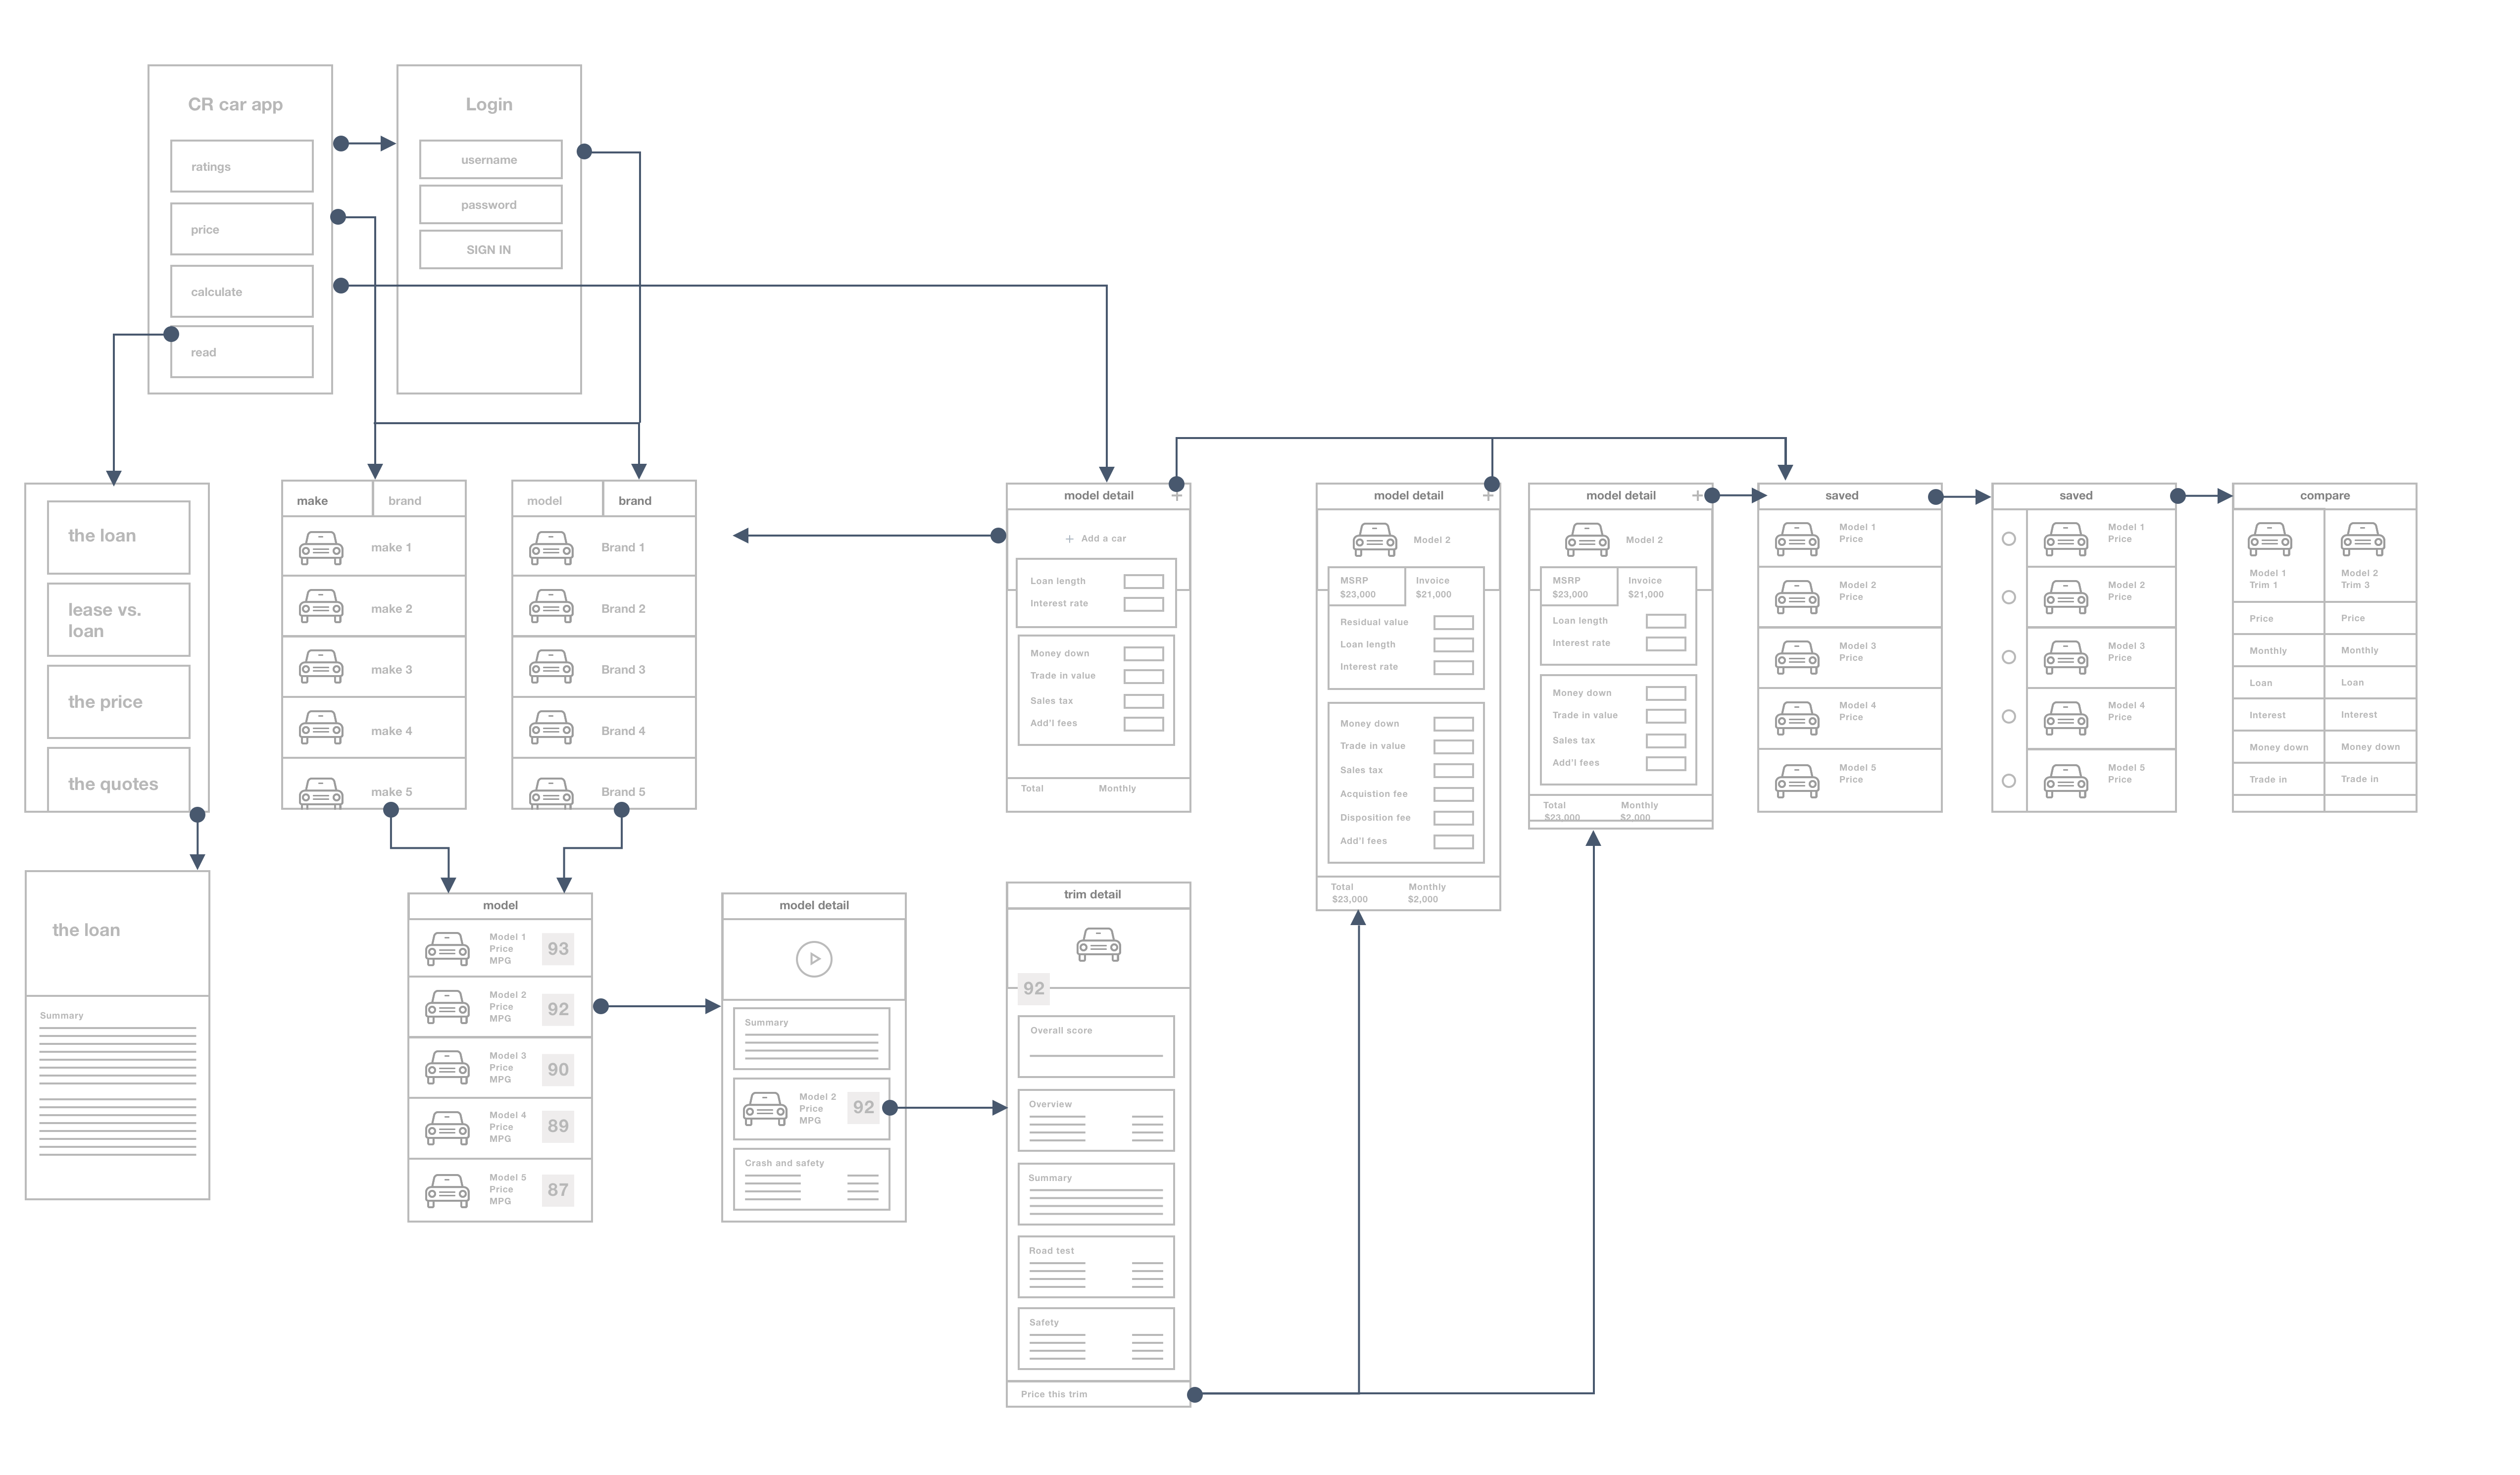
Wireframes
Our solution was to create an end to end car researching guide. Our MVP focused on the initial pain point. We started with a simple loan or lease calculator to allow users to input their potential asking prices or dealer offers to see their actual total and monthly costs with fees, taxes and trade in included. It was a small step in adding transparency to a very opaque process. We also allowed the user to look up any given car and pulled invoice or MSRP prices from our API. And then finally, we allowed users to upsell to a subscription to access the full database of reviews, scores and road test videos we were famous for, all integrated into the pricing tool.
05 BRanding
Typography and Colors
The branding was kept simple. All important call to actions and buttons were the distinct Consumer Reports Red. The rest was kept as a simple grey scale to allow content and visuals to stand out. We kept it native and all typography was Helvetica Neue, Apple’s default font at the time.
Helvetica Neue
A B C D E F G H I J K L M N O P Q R S T U V W X Y Z
a b c d e f g h i j k l m n o p q r s t u v w x y z
#EA2126
#3E3E3E
#E5E4E4
#F2F2F2
The App
06 Browse
Search by brand or type
Most of the people we spoke to began their car journey here. They were either loyal to a brand, “my family always bought Toyotas” or they knew the types of cars they needed (minivans, pickups, hybrid) due to a lifestyle decision. For example, a family of 7 needed a minivan that seated everyone. A lover of sustainability could filter down by hybrids or electric cars.
07 Filter
Narrow down to trim
Part of our research also included talking to the experts who tested the cars. Even though most users don’t differentiate down to the trim styles, we found that it was more accurate to display the full review by trim, as some cases can have major discrepancies in features, and therefore vast differences in price. This also had the added benefit of educated the users of the differences in trims as it was a common tactic of car salesman to upsell to a trim style to tack on a few hundred dollars.
08 Calculate
Price your car
Once you’ve chosen your trim, you can pull the price of your car into a loan or lease calculator. We pulled both MSRP and Invoice prices to display the maximum or minimum price respectively. The user can toggle between either to see the differences in payment, as well as add in additional details such as the trade in value of their old car, how much they could put down as a deposit, and the tax rate. All to increase transparency on their actual monthly price.
09 Save
Compare calculations
One thing that stood out to us in our ethnographic studies was that most of our users had a long spreadsheet of their own calculations, dealer offers, interest rates and loan terms. Most final decisions were made by tweaking numbers and comparing one offer over another. Many dealers were also open to matching a competitive bid, so we included a feature to save the calculations from your research and bring them with you to the negotiations. We hypothesized that being able to calculate any changes in the deal in real time would help our users feel more empowered.
10 More pages
And lots more…
And that’s just the main journey. We also included a collection of editorial content from our experts on all facets of car buying. There’s also a terms translator, to help the user understand things like, trade in values, residual value and money factors. All to help and educate the user through their buying experience.


The experience
Overall the experience was a great learning process. Due to having a 60 day MVP, I learned to work very closely alongside development and QA, often times sitting next to each other and pair designing/programming. After initial launch we slowly customized our sprints to have a more staggered approach with design and research about 1 or 2 sprints ahead. However, we never lost the close collaboration and open dialogue of dropping by each other’s desks and finalizing UI tweaks and interactions. The workflow we developed is something I still follow to this day.
- Top 10 in Lifestyle on App Store at launch
- Foothold in app space
- Increased brand awareness
- Increased subscriptions through in-app purchases